Reference Change Value: A laboratory tool for interpreting test results
Reference Change Value: Uma ferramenta do laboratório para interpretar resultados de exames
Flávia Martinello1, Alice Berlanda Seidler2, Mauren Isfer Anghebem3
1 Farmacêutica, Pós-doutora em Análises Clínicas, Professora do Departamento de Análises Clínicas da Universidade Federal de Santa Catarina/UFSC, Florianópolis, SC, Brasil.
2 Estudante, Graduanda em Ciências Farmacêuticas pela Universidade Federal de Santa Catarina/UFSC, Florianópolis, SC, Brasil.
3 Farmacêutica, Doutora em Ciências Farmacêuticas/Análises Clínicas, Professora Adjunta da Escola de Medicina e Ciências da Vida da Pontifícia Universidade Católica e Professora Adjunta do Departamento de Análises Clínicas da Universidade Federal do Paraná/UFPR, Curitiba, PR, Brasil.
Received on Oct 03, 2024
Approved on Oct 06, 2024
DOI: 10.21877/2448-3877.202400200.en
INTRODUCTION
The stages of a laboratory examination are grouped into phases, as shown in Figure 1, in the following order: Pre-pre-analytical phase, which involves the examination request, patient guidance, and preparation, occurring outside the laboratory; Pre-analytical phase, which includes patient reception and identification, sample collection, storage, transport, and preparation; Analytical phase, which encompasses the examination process along with quality control; Post-analytical phase, which involves preparing the report with any necessary interpretative comments, releasing the result, and communicating critical values; and the Post-post-analytical phase, which entails interpreting the result and making decisions based on it.(1,2)
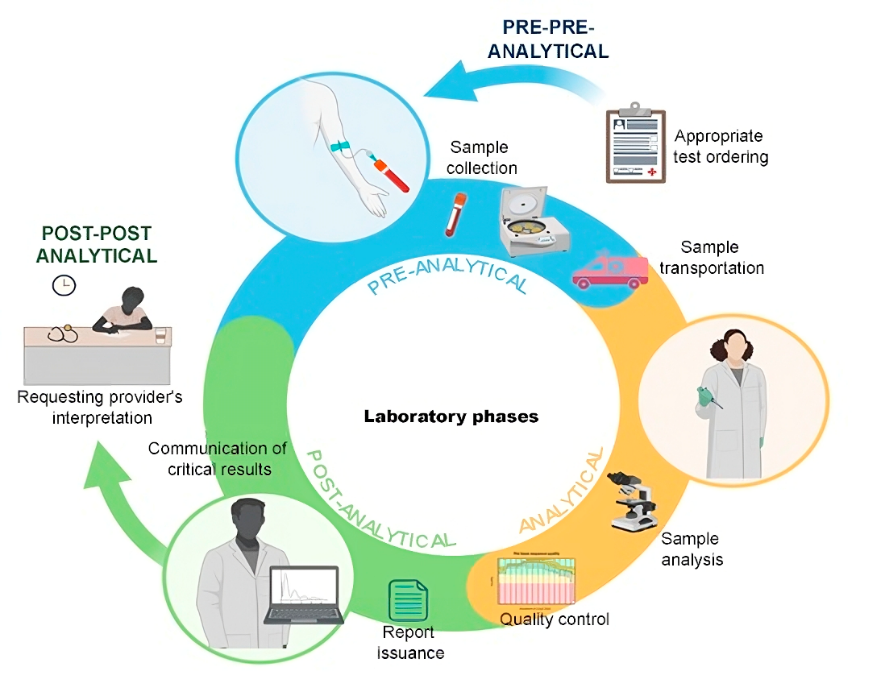
Figure 1
Stages of the laboratory examination process.
Source: Authors
Quantitative laboratory test results are interpreted by comparison with reference values or intervals obtained from a population with a known health status. These comparisons may be cross-sectional or longitudinal. Cross-sectional comparison involves comparing a patient’s analyte result with the range of values for that analyte obtained from a group of apparently healthy individuals. This type is known as “population-based” reference intervals and is used for disease diagnosis or screening. Figure 2 illustrates the process of obtaining reference intervals.
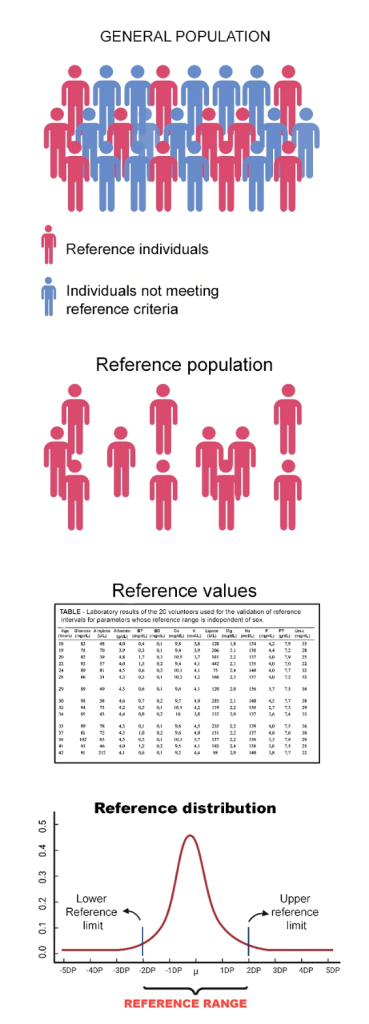
Figure 2
Process of obtaining reference intervals.
Source: Authors.
Conventional population-based reference intervals, whether generated by an individual laboratory or harmonized, are of very limited utility in evaluating an individual’s results for screening or diagnosis, as many individuals will have values that are highly atypical for them but still fall within the reference intervals.(3)
Longitudinal comparisons involve comparing a patient’s recent value with previous values for the same analyte. This comparison can help detect a change in health status and is therefore used for patient monitoring. Figure 3 illustrates, in both list and graph form, a patient’s past results for analyte X.
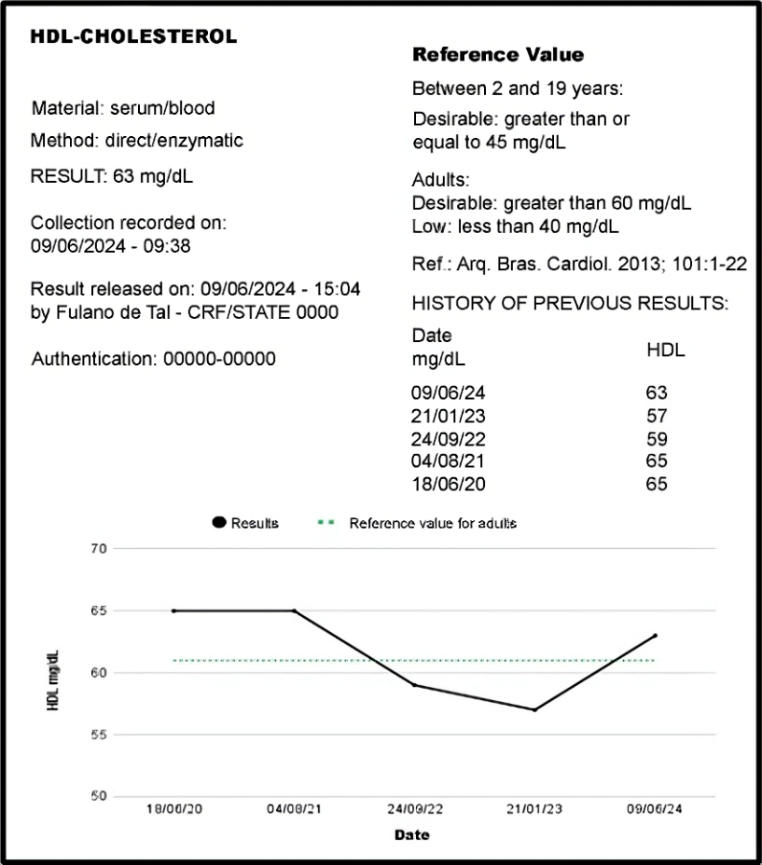
Figure 3
Section of a laboratory report presenting the current result and previous results of a patient in both list and graph form.
Source: Authors
Including previous patient results directly in the report enhances quality in the post-analytical phase, as it allows both healthcare professionals and patients to recall prior results and understand the progression of the laboratory marker. In this way, the laboratory treats the patient as their own reference rather than as part of a reference population. Ideally, a patient’s test results should be compared to their own individualized reference values—a personalized reference value.(4)
In this context, several factors may influence variations between sequential results for an individual. A result differing from the previous one can stem from pre-analytical, analytical, or biological variation.(5) These three types of variation must be considered to determine whether a change in a result relative to a prior one is significant.(3)
Depending on the study design, biological variation can be classified as intrapersonal biological variation, when studying the variation of an analyte’s results in a single individual under a homeostatic equilibrium condition; within-subject biological variation, when studying within-subject variation of an analyte’s results across multiple individuals under homeostatic equilibrium conditions; and between-subject biological variation, or biological variation of a group, when studying the variation of an analyte’s results among multiple individuals under homeostatic equilibrium conditions.(5)
Intrapersonal biological variation, or within-subject variation, is the variation of an analyte around the individual’s homeostatic set point. Also referred to as random biological variation, it cannot be predicted but can be estimated with appropriate statistical methods.(5) The difference between intrapersonal and within‐subject biological variation lies in the data sources used to calculate these parameters. Within‐subject biological variation is calculated using intrapersonal variations across a group (population), so it is not specific to an individual, while intrapersonal biological variation is obtained from repeated measurements of the same individual and is thus specific to that individual.(5) In recent years, significant progress has been made in deriving, calculating, estimating, and reporting biological variation data and derived parameters.(6)
Random within-subject biological variation of analytes is not synonymous with physiological rhythm. Physiological rhythms are systematic, partially predictable variations and can be classified, based on frequency, as ultradian (<24 hours), circadian (approximately 24 hours), and infradian (>24 hours).(5)
Due to the ultradian rhythms of analytes, the comparison of a current laboratory test result cannot be made against a previous result obtained from a sample collected at a different time of day; for example, if the previous sample was collected in the afternoon and the current one in the morning. For reliable comparisons, the pre-analytical phase must be standardized, meaning it should be very similar, considering factors such as collection time, fasting duration, preparation for collection, collection procedure, lifestyle, and other pre-analytical variables that may affect the test result. Additionally, in some cases, sampling at the same time on consecutive days may not be sufficient to eliminate infradian variations, such as those related to lipids, vitamin D, calcium, etc., especially if the interval between consecutive measurements approaches the infradian periods of the analyte being tested.(5)
Figure 4 illustrates intrapersonal, within-subject and between-subject biological variation of a biochemical analyte.
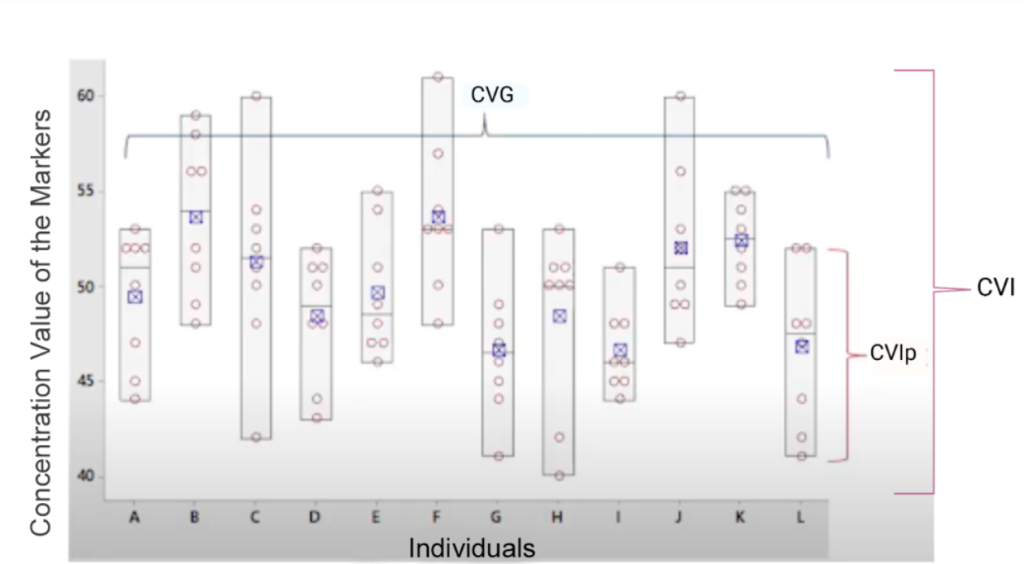
Figure 4
Components of the biological variation of an analyte: intrapersonal, within-subject and between-subject biological variation.
Legend: CVIp: Intrapersonal biological variation coefficient. CVI: within‐subject biological variation. CVG: between‐subject biological variation. Source: Adapted from Johnson, 2020.(7)
The European Federation of Laboratory Medicine (EFLM) provides data on biological variation (%) in healthy individuals, following an assessment of study quality, free of charge for users worldwide.(6)
Additionally, there are studies that report the biological variation (%) of certain analytes in individuals with specific disease states. However, for a range of analytes, data is either unavailable or limited.(8,9)
Information on interindividual biological variation is indirectly used to interpret laboratory test results, as it is employed to calculate the individuality index of an analyte. The ratio between within-subject biological variation (CVI) and between-subject biological variation (CVG) is known the individuality index (II).(6) For most individuals, the fluctuation in analyte concentration over time is less than the dispersion of the reference interval; that is, intraindividual biological variation is generally lower than interindividual biological variation, resulting in an II of less than one (1.0).(10)
If the II is below 0.6, the analyte exhibits high individuality, which means that the variation between the individual’s results is small relative to the reference interval range, rendering the latter less useful for interpreting the results, as the individual variation is not visible within the population reference interval. In such cases, there is a risk of considering the individual’s result as a normal physiological variation when the analyte values are significantly far from their homeostatic set point but still fall within the reference interval.(11,12) Conversely, if the II is above 1.4, the analyte shows low individuality, and the value dispersion in each individual covers most of the dispersion among individuals represented by the reference interval, making it a useful tool for test interpretation. Generally speaking, the utility of the population reference interval for monitoring patients is limited when the II is below 0.6 and acceptable when the II is above 1.4. For an analyte with an II between 0.6 and 1.4, the use of population reference intervals is at the clinician’s discretion.⁽¹³⁾
For example, glycated hemoglobin is an analyte that exhibits high individuality (II = 0.16), meaning that the reference interval (RI) is of limited usefulness, as the individual’s variation is not visible within the RI range. On the other hand, blood pH is a parameter with low individuality (1.75), indicating that the reference interval (RI) is quite useful, as even a small variation in the individual becomes apparent within the RI range.
Finally, the analytical variation of the method chosen for measuring the analyte is another variable that can influence the interpretation of consecutive laboratory results, and this information is available only to the laboratory. Analytical variation, also known as analytical precision, represents the dispersion of results from the control sample in the internal quality control of the laboratory test. The precision of the method is calculated using the standard deviation of the mean of the results and is expressed as a percentage in terms of the coefficient of variation (CV) of the mean.
Considering that information on the analytical performance of methods (precision) is proprietary to laboratories, laboratory professionals can actively engage in strategies to enhance the patient experience in healthcare by developing and contributing high-quality data to facilitate timely and meaningful communication and interpretation of test results.⁽¹⁴⁾
RCV – Reference Change Value
When using traditional reference intervals, an individual’s analyte results may shift from within the interval to outside it (and vice versa) without clinical significance, likely prompting unnecessary clinical actions, such as repeat test requests.
A much better way to monitor individuals is by using the RCV, or reference change value, translated into Portuguese as “diferença crítica,” “valor de referência para alteração,” or “valor de referência mudança.”(3) The RCV was introduced by Harris and Yasaka(15) in 1983 and is defined as the statistically significant difference between two results from the same individual, taking measurement error into account. Thus, the RCV serves as a tool for evaluating the significance of differences in serial results for an individual.(16) To conclude that the difference between two consecutive results is significant and may be biologically relevant (indicating a change in health status), the difference must exceed the RCV, hence its designation as the critical difference.”⁽¹⁰⁾
The formula for defining the RCV of each analyte, which depends on the analytical variation of the laboratory method used and the CVI, according to Fraser and Harris (1989)⁽¹⁷⁾, is:
RCV = 21/2x Z x (CVA2 + CVI2)1/2
where CVA is the analytical variation coefficient of the measurement method for the specific analyte, CVI is the within-subject biological variation coefficient, and Z = 1.65 for p < 0.1, 1.96 for p < 0.05, or 2.33 for p < 0.01.
Considering that the calculation of the RCV was initially proposed for measurements with a symmetrical or Gaussian (also known as normal) distribution, over the years, other authors have advocated that the approach of converting the RCV to a natural logarithm (ln-RCV) should be primarily used when measured values are considered normally distributed after ln transformation. Consequently, other methods for calculating the RCV have emerged for asymmetrically distributed measurements. ⁽11,18⁾
With the asymmetrical approach, the deviation (σ) of the log-normal distribution of the total variation coefficient (CVT) is calculated using the formula:
σ = [ln((CVT/100)2 + 1)]1/2
where CVT=[(CVI2 + CVA2)]1/2
This approach results in asymmetrical RCV limits. The asymmetrical critical difference limit for an increase (positive RCV) and for a decrease (negative RCV) in laboratory results is determined by the following formulas, respectively:
RCV pos = [exp(1.96 x 21/2 x σ) – 1] x 100
RCV neg = [exp(-1.96 x 21/2 x σ) – 1] x 100
In practice, the difference is that the symmetrical RCV yields a single value as the critical difference, whereas the asymmetrical RCV yields two: one to be exceeded when there is an increase in the result and another for a decrease in the patient’s result. When the CVT is < 5–10%, the symmetrical and asymmetrical formulas will yield similar results, as illustrated in the practical example below.
Regardless of the chosen formula, the within-subject biological variation coefficient from the EFLM database (https://biologicalvariation.eu/) is used when the intrapersonal biological variation coefficient is unknown.
The EFLM database itself operates by initially requiring a search for the analyte (which must be entered in English). Next, the biological variation data for the analyte is displayed, along with an option to select the RCV calculation (Figure 5). For the calculation, you must enter the analyte’s CVA from your laboratory, and the asymmetrical RCV will automatically be presented.
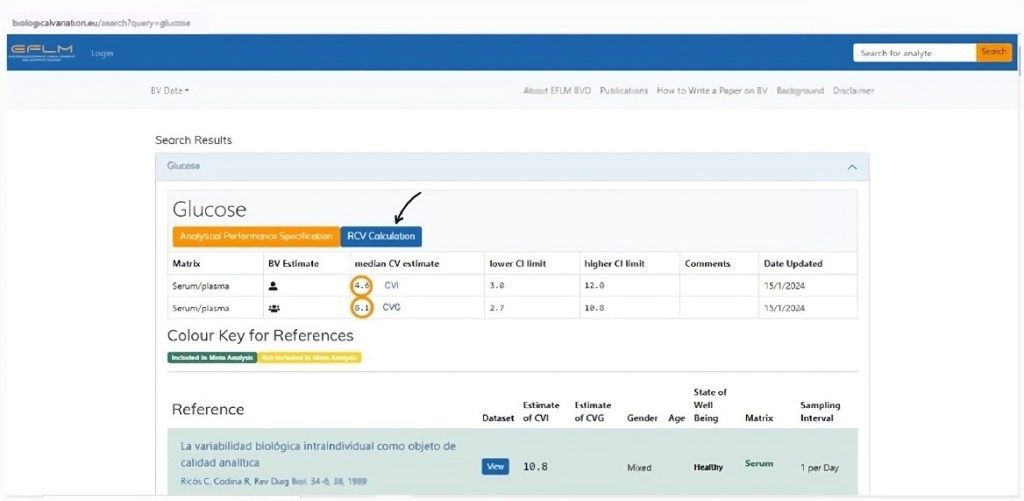
Figure 5
Biological variation database website of the European Federation of Laboratory Medicine (EFLM).
Legend: The orange circles indicate the CVI and CVG of the queried analyte. The black arrow indicates where to access the RCV calculation for the analyte, taking into account the laboratory’s CVA. Source: https://biologicalvariation.eu/search?query=glucose
Additionally, it is important to note that, although the CVI can be assumed constant as it does not frequently change, the CVA (analytical imprecision) varies across laboratories and methods. Table 1 shows that the RCV depends on the CVA and that this relationship is non-linear, using an example for capillary glucose with a hypothetical CVI of 3.8% and a 95% confidence interval (z = 1.65).
Table 1. RCV for capillary glucose, considering a hypothetical within-subject biological variation coefficient (CVI) of 3.8% at different levels of analytical imprecision (p<0.05).
| Imprecision (CVA, %) | RCV (%) |
| 1.0 | 9.2 |
| 2.0 | 10.0 |
| 3.0 | 11.3 |
| 4.0 | 12.9 |
| 5.0 | 14.7 |
| 6.0 | 16.6 |
Additionally, some studies present the RCV used in the laboratory as a critical difference for the automatic release of patient results based on previous results, also referred to as a delta-check.(19,20) However, it is important to note that each laboratory has its specific RCV for each analyte, as it depends on the laboratory’s analytical variation. As an illustration, the influence of analytical variation is shown in Table 2,(12) which presents the probability of a 15% change in total cholesterol results (CVI 6%) relative to a previous result being significant, depending on the CVA.
Table 2: Probability of a 15% change in total cholesterol results being significant at different levels of analytical imprecision.
| Imprecision (CVA, %) | Probability of Significant Change(%) |
| 2.0 | 95 |
| 4,0 | 93 |
| 6.0 | 90 |
| 8.0 | 86 |
| 10 | 82 |
CVA: analytical coefficient of variation. Source: Fraser, 2012.⁽¹²⁾
In practice, there are often more than two sequential results available for an individual, allowing for the calculation of the significance of changes between each pair of consecutive measurements.⁽²¹⁾
PRACTICAL EXAMPLE
Considering a hypothetical CVA for glucose analysis of 4% and a hypothetical CVI for capillary glucose of 3.8%, the symmetrical RCV would be calculated as follows:
Critical difference with 90% confidence:
RCV = 21/2x Z x (CVA2 + CVI2)1/2
RCV = 1.414 x 1.65 x (42 + 3.82)1/2
RCV = 12.9%
Critical difference with 95% confidence:
RCV = 21/2x Z x (CVA2 + CVI2)1/2
RCV = 1.414 x 1.96 x (42 + 3.82)1/2
RCV = 15.3%
Critical difference with 99% confidence:
RCV = 21/2x Z x (CVA2 + CVI2)1/2
RCV = 1.414 x 2.58 x (42 + 3.82)1/2
RCV = 20.1%
The different probabilities (Z) in the confidence of the critical difference mean that the more the healthcare professional wants to trust the RCV, the greater it will be.
To calculate the asymmetrical RCV, the total coefficient of variation (CVT) must be calculated in decimal values:
CVT=[(CVI2 + CVA2)]1/2
CVT=[(3.82 + 42)]1/2
CVT=[(14.44 + 16)]1/2
CVT=[30.44]1/2
CVT=5.517%
And the standard deviation of the CVT must be calculated as:
σ = [ln((CVT/100)2 + 1)]1/2
σ = [ln(0.05522 + 1)]1/2
σ = [ln(0.05522 + 1)]1/2
σ = [ln(0.003 + 1)]1/2
σ = [ln(1.003)]1/2
σ = [0.00299]1/2
σ = 0.0547
The asymmetric RCV, or the difference considered critical for an increase in the result, should be calculated as:
RCV pos = [exp(1.96 x 21/2 x σ) – 1] x 100
RCV pos = [exp(1.96 x 1.414 x 0,0547) – 1] x 100
RCV pos = [exp(0.1516) – 1] x 100
RCV pos = [1.1636 – 1] x 100
RCV pos = [0.1636] x 100
RCV pos = 16.36%
And the difference considered critical for a decrease in the result as:
RCV neg = [exp(-1.96 x √2 x σ) – 1] x 100
RCV neg = [exp(-1.96 x 1.414 x 0.0547) – 1] x 100
RCV neg = [exp(-0.1516) – 1] x 100
RCV neg = [0.8593 – 1] x 100
RCV neg = [-0.1406] x 100
RCV neg = -14.06%
In a hypothetical situation where a patient, who had a blood glucose level of 152 mg/dL three months ago, started oral hypoglycemic treatment with a daily dose of 2.5 mg of glibenclamide and subsequently returned for a follow-up test showing a result of 133 mg/dL (a reduction of 12.5%), the question arises: is this reduction significant? Considering both symmetric and asymmetric calculated RCV, the reduction is not significant, as the difference should exceed 15.3% or 14.06%. Thus, it is first necessary to assess the patient’s adherence to the medication regimen. If adherence is confirmed, the treatment should be complemented with non-pharmacological approaches, such as introducing physical activity and/or dietary modifications, or adjusting the daily medication dose.
This approach enables a personalized interpretation of the patient’s results, based on within-subject biological variation data and laboratory information, including the previous result and the analytical coefficient of variation.
PERSPECTIVES
The reference interval based on the homeostatic model can be calculated using an individual’s previous test results obtained under a clinical steady-state condition, that is, by understanding the individual’s intrapersonal biological variation. With advancements in information technology, laboratories now have data from millions of patients, enabling the implementation of personalized laboratory diagnostics.(4) Applications for calculating individualized reference intervals, based on an individual’s previous results, are already being developed by some research groups.(6) The use of personalized reference intervals for calculating customized RCV can be considered a fundamental element of predictive, preventive, and particularly personalized laboratory medicine. With the dissemination of this knowledge, laboratories may be able to present personalized RCV in patient reports.
LIMITATIONS
Fraser (2012)(12) reports several disadvantages in the use of RCV, including the possibility that a) statistical information may overwhelm professionals, b) the use of the Z-score could obscure clinical judgment, c) RCV may depend on test frequency, d) some biological variation might depend on health status, e) proper application requires a sophisticated laboratory information management system, f) laboratory staff and clinicians need further education, and g) terminology can be confusing.
Other authors indicate that caution is necessary when using RCV for tumor markers to guide medical decisions.⁽9,22⁾ Rossum and colleagues (2022)⁽22⁾ argue that studies on biological variation are conducted in healthy volunteers, typically only in adulthood, and even those conducted in disease states, such as cancer cases, are affected by the dynamics of the tumor marker, which is highly dependent on the tumor type, stage, treatment used, biomarker half-life, etc. Furthermore, another limitation of using RCV for tumor markers is that the significant change, based on statistical probability (Z), is not necessarily of interest to the clinician, who needs medical decision levels based on the probability of a patient responding to treatment, the likelihood of cancer recurrence after curative treatment, or the probability of resistance to treatment after an initial response. (22)
FINAL CONSIDERATIONS
In this review, we summarize the application of biological variation in using RCV and the role of RCV in supporting the interpretation of consecutive laboratory results. Each individual has a “personal” range of values that encompasses only a portion of the common reference interval. Consequently, individuals may experience significant changes in their results that go unnoticed, as these changes are considered normal when evaluated against the common reference interval. Knowledge and use of RCV assist in addressing this issue. However, biological variation data have limitations based on the characteristics of the studied population, which suggests the approach of a personalized reference interval.
The use of RCV should be as prevalent as population-based reference intervals in clinical laboratories. RCV should be available as a tool for clinical decision-making, especially in the monitoring of individual patients.
REFERENCES
- Tate JR, Johnson R, Barth J, Panteghini M. Harmonization of laboratory testing – Current achievements and future strategies. Clinica Chimica Acta. 2014 May;432:4-7. DOI: 10.1016/j.cca.2013.08.021.
- Tan JG, Omar A, Lee WB, Wong MS. Considerations for Group Testing: A Practical Approach for the Clinical Laboratory. The Clinical Biochemist Reviews. 2020 Dec;41(3):79-92. DOI: 10.33176/AACB-20-00007.
- Fraser CG. Valores de mudança de referência: o caminho a seguir no monitoramento. Annals of Clinical Biochemistry. 2009 Mar 5;46(3):264-265. DOI: 10.1258/acb.2009.009006.
- Coskun A, Sandberg S, Unsal I, Serteser M, Aarsand AK. Personalized reference intervals: from theory to practice. Critical Reviews in Clinical Laboratory Sciences. 2022 May 17;1-16. DOI: 10.1080/10408363.2022.2070905.
- Coskun A, Zarepour A, Zarrabi A. Physiological Rhythms and Biological Variation of Biomolecules: The Road to Personalized Laboratory Medicine. International Journal of Molecular Sciences. [Internet]. 2023 Mar 27 [Cited Nov. 8, 2023];24(7):6275. DOI: 10.3390/ijms24076275.
- Sandberg S, Carobene A, Bartlett B, Coskun A, Fernandez-Calle P, Jonker N et al.. Biological variation: recent development and future challenges. Clinical Chemistry and Laboratory Medicine. 2022 Dec 20;61(5):741-50. DOI: 10.1515/cclm-2022-1255.
- Johnson P. Setting Analytical Quality Goals with Biological Variation Data. Pearls of Laboratory Medicine. Clinical Chemistry Contents. American Association of Clinical Chemistry: Better health through laboratory medicine. DOI: 10.15428/CCTC.2019.310276 Available at: https://www.youtube.com/watch?v=MjIbHq6pMCI. Accessed: March 13, 2024.
- Ricós C, Álvarez V, Perich C, Fernández-Calle P, Minchinela J, Cava F, Biosca C et al.. Rationale for using data on biological variation. Clinical Chemistry and Laboratory Medicine. 2015 [Cited Sep. 16, 2024];53(6).
- Dittadi R, Fabricio A, Gion M. Biological variation and reference change value as decision criteria in clinical use of tumor biomarkers. Are they really useful? Clinical Chemistry and Laboratory Medicine. 2022 Mar;60(6)e136-e137.
- Badrick T. Biological variation: Understanding why it is so important? Practical Laboratory Medicine.2021 Jan 4;23:e00199. DOI: 10.1016/j.plabm.2020.e00199.
- Fraser CG. Making better use of differences in serial laboratory results. Annals of Clinical Biochemistry. 2012 Jan;49(Pt 1):1-3. DOI: 10.1258/acb.2011.011203.
- Fraser C. Reference change values. Clinical Chemistry and Laboratory Medicine. 2012 May;50(5): 807-812. DOI: 10.1515/cclm.2011.733
- Braga F, Panteghini M. Generation of data on within-subject biological variation in laboratory medicine: an update. Critical Reviews in Clinical Laboratory Sciences. 2016 Mar;53(5):313-25. DOI: 10.3109/10408363.2016.1150252
- Klatt EC. Cognitive factors impacting patient understanding of laboratory test information. Journal of Pathology Informatics. 2024 Dec 1;15:100349. DOI: 10.1016/j.jpi.2023.100349.
- Harris EK, Yasaka T. On the calculation of a “reference change” for comparing two consecutive measurements. Clinical Chemistry, v. 29, n. 1, p. 25-30, 1983 Jan.
- Åsberg A, Lian IA, Odsæter IH, Mikkelsen G. Testing the limits: the diagnostic accuracy of reference change values. Scandinavian Journal of Clinical and Laboratory Investigation. 2021 Mar;81(4):318-323. DOI: 10.1080/00365513.2021.1904517.
- Fraser CG, Harris EK. Generation and application of data on biological variation in clinical chemistry. Critical Reviews in Clinical Laboratory Sciences. 1989 Jan;27(5):409-37. DOI: 10.3109/10408368909106595.
- Fokkema MR, Herrmann Z, Muskiet FA, Moecks J. Reference change values for brain natriuretic peptides revisited. Clinical Chemistry. 2006 Aug;52(8):1602-3. DOI: 10.1373/clinchem.2006.069369.
- Feitosa MS, Bücker DH, Santos SME, Vasconcellos LS. Implementation of criteria for automatic release of clinical chemistry test results in a laboratory at an academic public hospital / Implantação de critérios de liberação automática de resultados de bioquímica em um laboratório de hospital público universitário. Jornal Brasileiro de Patologia e Medicina Laboratorial. 2016 May;52(3): 149-156.
- Fernandez DC, Avinash SS, Malathi M, Shivashankara AR, Kumar A, Fernandez PA. Establishing the reference change values (RCVs) and validating the delta check auto-verification in a clinical biochemistry laboratory. Muller Journal of Medical Sciences and Research. 2017 Jan-Jun;8(1):p 42-46, DOI: 10.4103/0975-9727.199363.
- Jones GR, Chung JZ. Cálculo de valores de mudança de referência usando mais de dois resultados é uma tarefa difícil: uma resposta. Annals of Clinical Biochemistry. 2017 May;54(3):414-415. DOI: 10.1177/0004563217690177.
- Rossum H, Meng Q, Ramanathan L, Holdenrieder S. A word of caution on using tumor biomarker reference change values to guide medical decisions and the need for alternatives. Clinical Chemistry and Laboratory Medicine. 2021 Oct;60(4): 553-555. DOI: 1515/cclm-2021-0933.
Correspondence
Flávia Martinello
E-mail: [email protected]
