Estimates of measurement uncertainty associated with Clinical Laboratories and their implications for clinical practice
Estimativas de incerteza de medição associada ao Laboratório Clínico e suas implicações na prática clínica
José Robson Venturim1, Luiza Valli Vieira2
1 Grupo Tommasi Laboratórios, Diretor Técnico, Farmacêutico-Bioquímico; Especialista em Análises Clínicas e Mestre em Patologia Geral das Doenças Infecciosas.
2 Grupo Tommasi Laboratórios, Coordenadora/Responsável Técnica Cromatografia, Doutora em Química.
Received on Nov 01, 2024
Approved on Nov 15, 2024
DOI: 10.21877/2448-3877.202400216.en
INTRODUCTION
A measurement is the act of assigning a numerical value to a specific quantity through an experimental process.(1) In this process, the value obtained (i.e., the result) is determined based on a comparison with a known standard, thus representing an estimate. However, it is crucial to understand that every measurement includes a component known as “measurement uncertainty,” which is an integral part of the reported measurement result. It is important to emphasize that measurement uncertainty differs from measurement error (ME), defined as the “difference between the obtained value and the true value, when the latter is available.”(1)
Measurement uncertainty (MU) is a parameter that quantifies the doubt associated with the result of a measurement. By definition, the International Vocabulary of Metrology (VIM) describes measurement uncertainty as “a non-negative parameter characterizing the dispersion of the values attributed to a measurand, based on the information used.”(1) In other words, MU indicates the range within which the true value of the measurement is likely to lie. Since it is neither a negative nor a null parameter, there will always be a set of uncertainties (Expanded Uncertainty, designated as “U”) associated with the quantitative value of the measurand.(2) MU serves as an estimate that quantifies the reliability of measurement results, where greater uncertainty corresponds to lower reliability of the result.(3)
The information obtained through the measurement process allows the measurand to be assigned only a “range of reasonable values.” Relevant additional information can reduce the amplitude of this range (decreasing the uncertainty) that can be attributed to the measurand. However, even the most precise measurement cannot reduce the range to a single value due to the finite amount of detail in the definition of the measurand.(1)
The result of a measurement comprises the base result (BR) and the range formed by the MU, both above and below the value. The true value is contained within this range, ideally as close as possible to the central point, where the BR is located. In other words, the smaller the MU, the closer the true value will be to the BR.(1)
Figure 1 illustrates the arrangement of a result obtained from a measurement (base result, or BR), the true value, and the range of possible values around the BR, considering the MU.
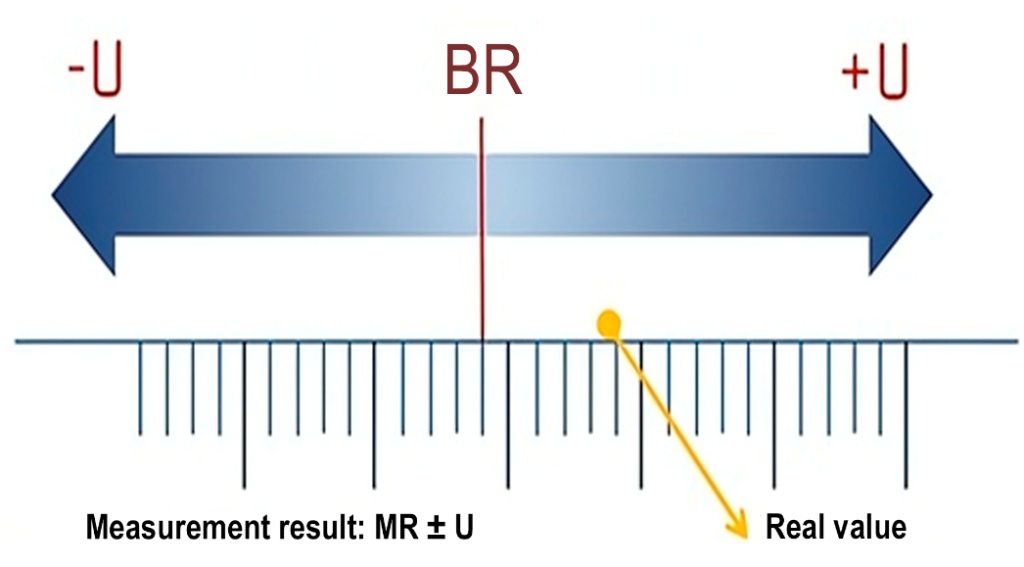
Figure 1: Demonstration of the distribution of measurement components.
Legend: BR, base result; U, expanded uncertainty; MR, measurement result. Source: ACC, 2024.(4)
Uncertainty is a statistical concept that reflects the effects of various factors arising during the measurement processes, impacting the obtained results.(5) According to the CLSI EP29-A guideline (Clinical and Laboratory Standards Institute)(5), uncertainty defines an interval within which the true value of the measurement is expected to lie, with a specified level of confidence. In the practice of measurement processes and analytical performance assessment, there are three main types of uncertainty: standard, combined, and expanded.(5)
Standard uncertainty refers to the imprecision determined in the laboratory, while combined uncertainty associates other potential sources, and expanded uncertainty takes into account the desired confidence interval for the application of the measurement. Assessing the measurement uncertainty of laboratory results is crucial for verifying the performance of the measurement system. Uncertainty provides laboratory professionals with a deeper understanding of the performance and limitations of their methods, enabling the identification of technical steps where uncertainty can potentially be reduced. For patient safety, it is essential that most laboratory tests fall within the analytical target for their clinical use, as this can significantly influence the clinician’s ability to accurately assess patients.(5)
Uncertainty can arise from various sources, such as measurement instruments, involving the limitations and precision of the devices used, the level of automation of the equipment, and the standardization of commercial analytical methods as opposed to methodologies developed and validated within the laboratory; environmental conditions, such as variations in temperature, humidity, etc.; measurement methods, including procedures, methodologies, protocols, and techniques; and individual differences of the operator, such as the skill and experience of the person performing the measurement, especially in non-automated methodologies.(6)
Understanding and specifying uncertainty is crucial to ensure the reliability and comparability of results, particularly in areas such as clinical laboratories, where important decisions are based on this data.(5) Figure 2 provides a cause-and-effect diagram, in a “fishbone” format, illustrating a hypothetical situation in which the sources of uncertainties in a laboratory measurement are studied.
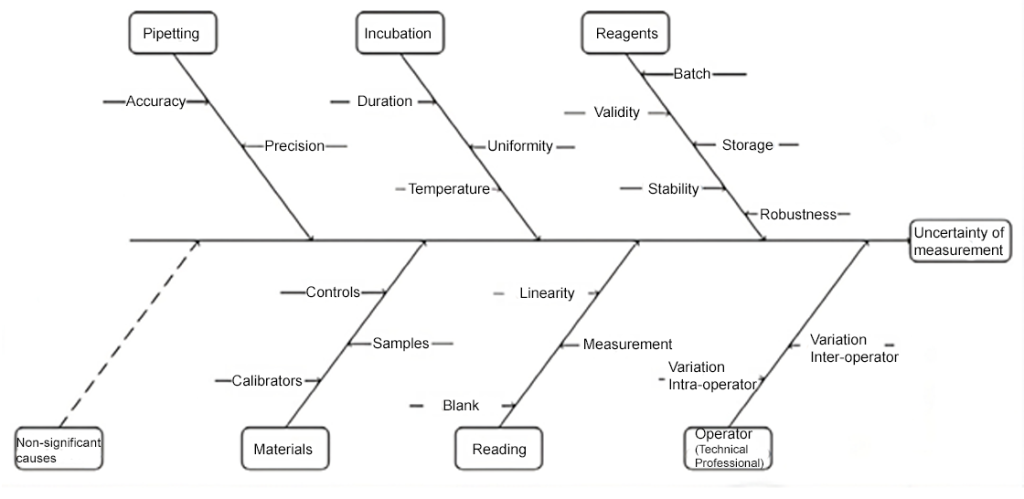
Figure 2: Schematic demonstration of identifying sources of uncertainties for determining the measurement uncertainty (MU) of a laboratory test.
Source: Pereira, 2016.(6)
Estimating and quantifying uncertainty in measurements is crucial for clinical laboratories for various reasons, with the main ones being precision and reliability characteristics. Uncertainty helps determine the accuracy and reliability of laboratory test results and is therefore essential to ensure that diagnoses and treatments based on these results are correct, due to the clinical inferences attributed to these laboratory results, directly influencing clinical decision-making.(7) Additionally, another important requirement, once measurement uncertainties are determined and presented alongside results, is comparability, as it allows for the comparison of results between different laboratories and analytical methods. Without an uncertainty estimate, it would be difficult to determine whether differences in results are significant or merely normal variations. For compliance with quality standards to meet norms and legislation, the specification of uncertainty is a requirement of international standards, such as ISO 15189-2012, or even national standards such as the 8th edition of the National Accreditation System Manual of the Department of Inspection and Quality Accreditation (SNA/DICQ) of the Brazilian Society of Clinical Analysis (SBAC) in item 5.5.1.4, where compliance with these standards is fundamental for the accreditation and recognition of clinical laboratories.(7)
The history of quality control in clinical analysis, particularly in clinical biochemistry, is extensive and rich. Fundamentally, there are two main aspects that are routinely monitored: imprecision, also known as random error, and inaccuracy, also called bias or systematic error of results. The internal quality control (IQC) system is primarily aimed at assessing imprecision, while external quality control (EQC), especially proficiency testing (PT), aims to evaluate inaccuracy. The origins of the concepts and applicability of EQC date back to the late 1940s, following the publication by Belk and Sunderman.(8) In contrast, IQC gradually evolved over the years, particularly from the 1970s onwards, when Westgard, Groth, and de Verdier introduced simulations as a scientific tool to assess and design control rules.(6)
A laboratory’s performance can be satisfactorily described in terms of random and systematic errors. The metric known as “total error” (TE) is defined as the “net effect of method bias and imprecision” and incorporates both types of error.(9) However, a common objection to TE is that if a known bias is included, why retain it? Additionally, bias has a sign, whereas imprecision is a characteristic of a distribution. Therefore, the quantities included in TE are not truly comparable.(10)
Determination of Measurement Uncertainties
Planning for the determination of measurement uncertainty
Just like the validation of laboratory methods, the estimation of measurement uncertainty also requires planning and a sequence of evaluations before its application in laboratory practice.(6) Methods developed in research and development (R&D) laboratories, “in-house”, or extensive modifications of already validated methods, require a more comprehensive and detailed validation process, unlike commercial methods that are validated by manufacturers and registered with regulatory bodies (ANVISA, FDA, etc.).
Within the process of analytical validation, many of the procedures needed to obtain data for the determination of MU will already have been conducted, especially if the approach used is of the “bottom-up” type, as recommended by the guide for the expression of measurement uncertainty (GUM).(3) In the context of clinical laboratories, where most methods used are standardized, registered, and validated by manufacturers in the form of kits or analytical systems, “top-down” approaches have been more applicable, particularly considering the limitations of information regarding method development due to patents and industrial secrecy, as well as the difficulty in obtaining certified reference materials (CRM) or certified reference standards (CRS).(11)
Once the strategy is chosen and considering the characteristics of the measurand and the analytical system, the planning for determining MU consists of:
- Description of the measurand, measurement range, and limit value of MU.
- Identifying and quantifying the uncertainty components (Quantifying the standard uncertainty component for intralaboratory reproducibility (uRw); Quantifying the uncertainty component associated with the method and laboratory bias (ubias).
- Converting the different uncertainties to standard deviation values of the measurand, through their variances.
- Determining the combined standard uncertainty (uc), by the quadratic sum of the individual standard uncertainties.
- Calculating the expanded uncertainty (U) considering the coverage factor (k).
The factor k can vary due to several factors, with one of the main ones being the precision of the item being measured. If the item does not have good repeatability, it will have a greater impact on the confidence interval, increasing the value of k, which varies according to the effective degrees of freedom adopted, as illustrated in Figure 3.

Figure 3: ‘k’ values corresponding to effective degrees of freedom (Veff).
Source: ACC, 2024.(4)
The coverage factor k multiplies the combined standard uncertainty to achieve a confidence level of up to 99.73% coverage, with the most commonly used being 95.45%, i.e., ±2 SD, as illustrated in Figure 4. This results in the expanded uncertainty (U), which corresponds to the measurement uncertainty (MU) applied to the value obtained for the measurand.(6) Higher values of k imply higher confidence levels; however, they also involve incorporating values with a larger range and more heterogeneous data, with flatter and more open curves, as illustrated in Figure 5.
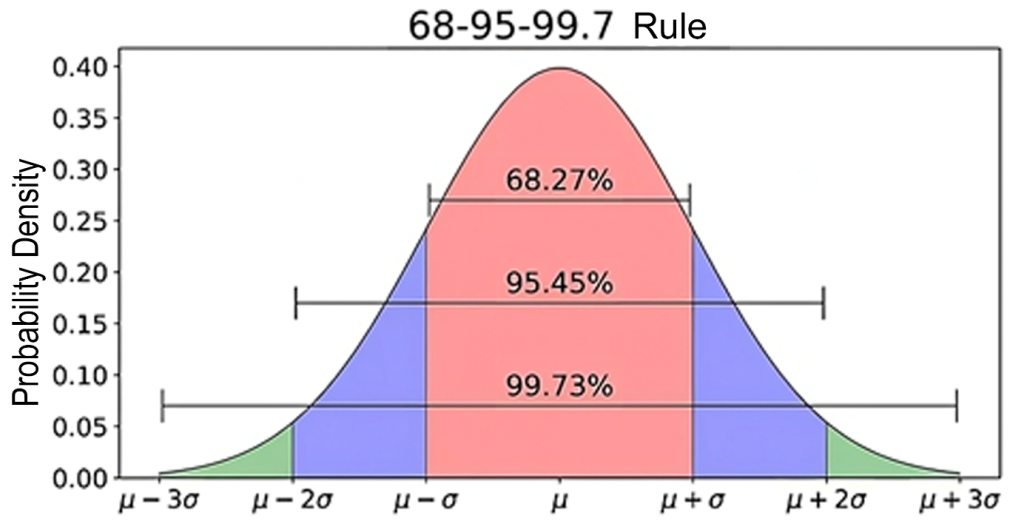
Figure 4: The normal (binomial) “Gaussian” statistical distribution describes the probability density function, in which most measurands in clinical laboratory tests are distributed within the range of ±2 SD.
Source: Adapted from https://towardsdatascience.com/understanding-the-68-95-99-7-rule-for-a-normal-distribution-b7b7cbf760c2.(12)
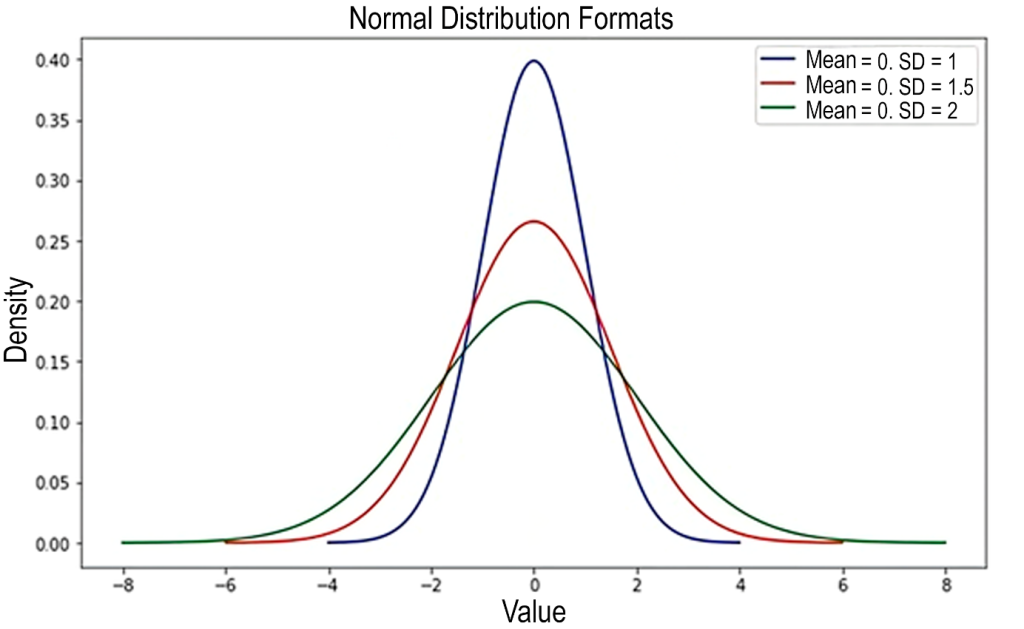
Figure 5: Illustration of the influence on increased variability relative to the value of k. The highest line (blue) represents k = 2. The other lines represent values above 2 for k.
Source: Adapted from https://medium.com/data-hackers/desvendando-o-teorema-central-do-limite-17cbb13beb1a.(13)
Metrological Traceability
Metrological traceability is defined as the “property of a measurement result by which the result can be related to a reference through an uninterrupted, documented chain of calibrations, each contributing to the measurement uncertainty”.(1) Thus, measurement uncertainty must be metrologically traceable, ensuring the comparability of results within a metrological traceability chain.(6) This chain is defined as the “sequence of measurement standards and calibrations used to relate a measurement result to a reference”.(1) Figure 6 illustrates an example of a metrological chain for a clinical laboratory test. Measurement uncertainties and biases are determined according to the metrological traceability chain. The precision, laboratory accreditation level, instability, and material costs increase significantly from clinical laboratories to the top of the hierarchy.(6) Conversely, measurement uncertainty, bias, and material availability decrease from bottom to top.
Although it is well implemented in general metrology, it is not widely applied in most clinical laboratory tests due to the unavailability of reference materials and reference methods. Additionally, “clinical traceability” is challenging to achieve due to the “physicochemical complexity” of human samples, primarily caused by intraindividual and interindividual biological variation.(14)
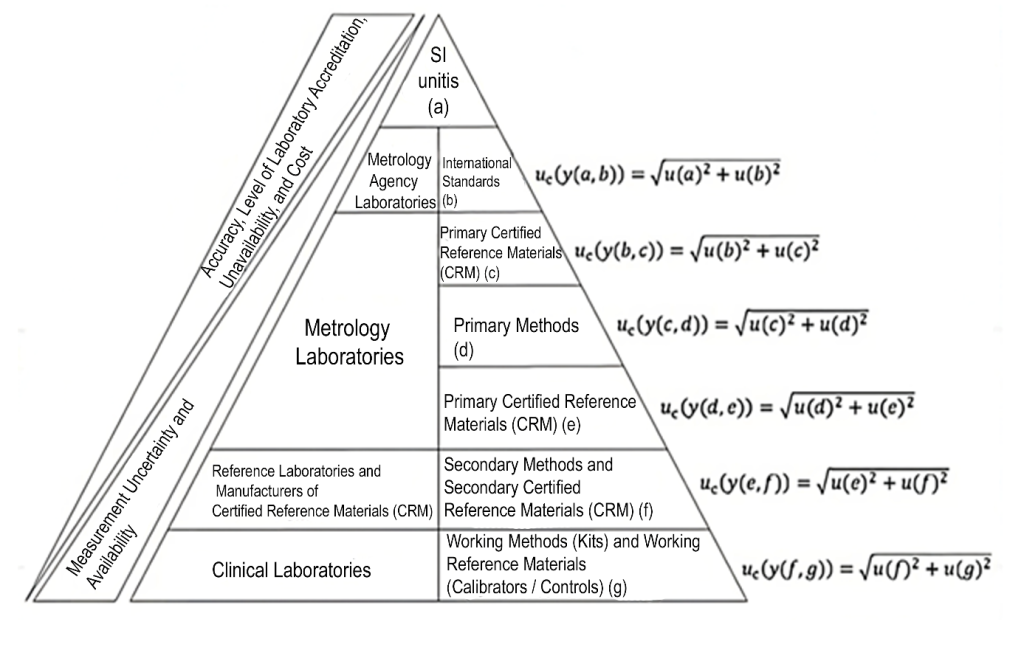
Figure 6: Metrological traceability chain involved in the measurement of results in clinical laboratory tests.
Source: Adapted from Pereira, 2016.(6)
Top-Down approach for measurement uncertainty calculation
Over time, various approaches have emerged for determining measurement uncertainty, each with its analytical implications. The approach now known as top-down aims to determine uncertainty from precision estimates based on interlaboratory performance assessment studies that can represent the overall uncertainty of the measurement process. This approach was first proposed by Wernimont in his 1980s publication.(15) It was revisited in 1995 by the Analytical Methods Committee (AMC) of the Royal Society of Chemistry(16) and the Nordic Committee on Food Analysis (NMKL), which also suggested a similar strategy based solely on intralaboratory evaluation data.(10,14) These recommendations arose because, in the top-down approach, most of the data needed for determining measurement uncertainty are already available from the results obtained when the method is validated, according to required standards.(17) This contrasts with the bottom-up approach described and standardized by the GUM (Guide to the expression of Uncertainty in Measurement),(3) published in 1993 by the International Organization for Standardization (ISO), which is a bottom-up approach. This approach requires the identification and quantification of individual sources of uncertainty that contribute to measurement uncertainty, which is not always possible in clinical laboratories. Therefore, in practice, the application of the GUM model is not directly feasible in a significant number of situations in clinical laboratories.(11)
In clinical laboratories, the most recognized statistical tools related to analytical performance are imprecision results, assessed through IQC programs, or inaccuracy results, evaluated via tools analyzing control samples with pre-established values or consensus means, such as proficiency testing (PT). These latter evaluations provide what is known as “bias”, one of the strategies for quality assessment.(10) In 2018, Rigo-Bonnin et al.(18) presented a study comparing three different strategies, all considered “top-down” approaches, to estimate the MU of a UHPLC-MS/MS method for quantifying tacrolimus, an immunosuppressant widely used in clinical practice. The strategies employed were: 1. Validation data specific to the laboratory, related to imprecision, and bias data based on the use of certified reference materials (CRM), while incorporating the uncertainty associated with calibrators used in the assays; 2. Data from participation in an IQC program, using commercial control materials (Liquicheck™ Whole Blood Immunosuppressant) and interlaboratory result comparisons (UNITY™ Interlaboratory Program); 3. Data from participation in an EQC program, specifically PT bias (IPTS: Immunosuppressant Proficiency Testing Schemes – CITAC – Cyclosporin and Tacrolimus (LGC™ Standards)). The three strategies yielded MU estimates of 11.8%, 13.2%, and 13.0%, respectively.(18) In 2019, Frenkel et al. proposed an algorithm aiming to standardize the use of “bias” by allowing the calculation of the standard uncertainty of “bias”. As an observable error in pre-established values, this bias may also incorporate random errors and, therefore, be included in the MU.(19)
Another example of the application of this type of approach was described by Eren and Oguz(20) in 2022, regarding the estimation of measurement uncertainty (MU) for a commercially available analysis for measuring glycated hemoglobin A1c in the validated analytical system, Atellica (Siemens Healthineers, Germany).(20) In this example, IQC and EQC results obtained over a 6-month period were used to calculate the MU, following the CLSI EP29-A document(5), using the following general formula:
uc = √(uRw2+ubias2),
U = k × uc,
where U is the expanded uncertainty, and k is the coverage factor (for a 95% confidence interval [CI], k = 2.0); uRw is the standard relative uncertainty due to intralaboratory imprecision, associated with potential random errors and obtained by calculating the coefficient of variation (CV%) from two levels of internal quality control (CV1% e CV2%), using the following formula:
uRw = √[(CV1 2 +CV2 2 )/2].
The external quality control results over 6 months, obtained from the EQAS program by Bio-Rad®, were used to calculate the bias uncertainty (ubias), which indicates possible systematic errors. The root mean square (RMS) of the monthly laboratory bias results (RMSbias) and the reference value uncertainty of the EQAS program (ucref) were calculated. Subsequently, the standard ubias was calculated using the following formula:
ubias = √ [(RMSbias)² + (ucref)²]
Where:
RMSbias = √ [(Σbias(CEQ)²/n],
with “n” being the number of rounds in the EQC program, and:
ucref=(sR/√n),
where sR is the average CV% of the external quality control result, and n is the number of pairs of groups participating in the EQAS program.
The combined standard uncertainty uc was quantified as follows:
uc =√(uRw2 + ubias2 ).
Finally, considering a 95% CI:
U = 2.0 × uc.
In the study in question, the average CV values at two levels were CV1% = 3.16 and CV2% = 2.79, evaluated against the quality specification required by the NGSP (National Glycohemoglobin Standardization Program), which recommends an imprecision of ≤4%. Consequently, the uRw% was 2.98. Parameters related to bias showed an RMSbias%=1.17 and ucref% =0.07. Applying the above formulas, the combined uncertainty (uc) was calculated as 3.2%, and the expanded uncertainty (U) was 6.4%. The decision value used as a diagnostic criterion for Diabetes Mellitus (DM) is 6.5% HbA1c of total HbA, and applying the expanded measurement uncertainty (U) obtained in the calculation: 6,5 x 0,064 = 0,416% ~ 0,4%. Therefore, the expression of the result, considering that the reporting of results should include the MU clearly, preferably in the form of “Test result ± MU” (whether as a numerical value in the same unit of measurement, percentage, or range)(22,23) for the clinical decision point would be:
HbA1c: 6.5%±0,4 (Range: 6.1% a 6.9%).
Considering the accepted analytical quality specification limit for HbA1c as ±0.5%,(24) the obtained U is analytically compliant. Therefore, the reported test value is the mean value within the probability range of containing the true value.
Bottom-up approach (recommended by the GUM) for measurement uncertainty calculation
The well-known and widely used approach, particularly in method validation processes, especially for “in-house” methods, is the bottom-up approach, which was adopted as a reference in analytical chemistry by EURACHEM starting in the 1990s.(3)
In the bottom-up approach, measurement uncertainty is calculated through a series of steps involving the identification and quantification of sources of uncertainty:
- Identification of Sources of Uncertainty: Identify all potential sources of uncertainty that may affect the measurement. This can include factors such as the precision of the measuring instrument, environmental conditions, the measurement method, among others.
- Types of Uncertainty: There are two types of uncertainty, Type A and Type B. These types of uncertainty differ because they are calculated using distinct procedures, but both are based on probability distributions, and the resulting uncertainty components for each type are quantified using variance or standard deviation.
2.1 Type A Uncertainties: Type A uncertainties are determined through statistical means and are calculated using the standard deviation of multiple measurements obtained through repetition. Since the best estimate for the expected value is the average of the data obtained in the process, the uncertainty will be the standard deviation of the mean. Additionally, it is necessary to assess how many degrees of freedom should be indicated. It is also important to emphasize that when appropriate and once identified, covariances should also be indicated. For example, consider an average result of 31.7 mg/dL of HDL-Cholesterol obtained after a set of 10 determinations with a coefficient of variation equal to 2.9. In this case, the standard deviation of the mean is approximately 0.92. This value reflects the Type A uncertainty associated with these measurements, being one of the components of the combined uncertainty.
2.2 Type B Uncertainties: Type B uncertainties are determined through other means, as they are not calculated using statistical methods, which requires a range of knowledge related to the instruments and materials involved in the process. This information includes manufacturer specifications, calibration certificates, and other specifics, as well as uncertainties found in manuals and other references.
- Quantification of Sources of Uncertainty: The quantification of each source of uncertainty can be performed using statistical methods, such as repeatability and reproducibility analysis, or through information provided by the instrument manufacturers. Convert the values of uncertainty components into standard deviation (SD) values relative to the measurand.(6,11)
3.1 Combination of Uncertainties: Individual uncertainties should be combined to obtain the total uncertainty. This is typically done using the root sum of squares (RSS) formula, which is a method for combining independent uncertainties. Where (uc) represents the combined uncertainty and (u12, u22, …, un2) are the individual uncertainties. The general relationship between the combined standard uncertainty uc (y) of a value y and the uncertainty of the independent parameters X1, X2, …Xn on which it depends is:(6,11)
3.2 Expansion of Uncertainty: Similarly to the top-down approach, in many cases, the combined uncertainty is multiplied by an coverage factor (k) to obtain the expanded uncertainty, which provides a wider confidence interval. The value of (k) is typically chosen based on the desired confidence level, for example, k = 2, for a 95% confidence level (CI 95%).
U = k × uc
Where (“U”) represents the expanded uncertainty.
These steps help ensure that the measurement uncertainty is well understood and quantified, allowing for better interpretation of measurement results.(6,11)
Influence of measurement uncertainty in laboratory and clinical practice
MU can have significant impacts on practical results, influencing the interpretation and reliability of obtained data, especially if not taken into account or if professionals responsible for interpreting laboratory test results are not adequately familiar with this concept.(6) Knowledge of MU estimates is particularly important when a measured value is close to a cutoff point defined by guidelines or medical consensus for clinical decision-making, such as establishing a diagnosis of a health condition or disease. The previously discussed example of 6.5% HbA1c as a decision criterion for DM diagnosis illustrates this point well. A hypothetical HbA1c result that is slightly above the threshold for diagnosing DM, such as 6.7%, with the MU of the method estimated at ±0.4%, would effectively be reported as 6.7%±0.4%. This result, therefore, does not meet the statistical and metrological conditions necessary to support clinical decision-making satisfactorily, considering that the true value of the measurement could be below 6.5%.(24) Hence, when diagnosing DM, the results of other laboratory tests and associated symptoms should be considered.
In this context, Supplement 6 of the GUM, translated by INMETRO in 2022 and titled “Evaluation of Measurement Data – The Role of Measurement Uncertainty in Conformity Assessment”(25), provides a series of criteria and guidelines related to the conformity assessment of a result in relation to its intended purpose, such as limits and tolerance intervals, probability of conformity, acceptance intervals, and risks to the consumer/client. Additionally, the CLSI EP29-4 document establishes criteria and guidelines for MU and its expression in clinical laboratory results.(5)
The information required to report the result of a measurement varies according to its intended use. In a clinical laboratory, the end consumer is the patient or blood donor, who is not responsible for their own diagnosis or monitoring. The primary client, in this case, is the physician or other professional responsible for the technical action, such as screening, diagnosis, or follow-up.(6) The professional making decisions based on laboratory results must understand the purpose and value of MU for judgment. Otherwise, measurement uncertainty reports can raise doubts that compromise clinical decision-making. These skills are rare among physicians and other healthcare professionals, who typically do not request this information due to a lack of understanding of its concept. For this reason, most clinical laboratories, particularly hospital laboratories, do not report measurement uncertainty, as it may not add value to most clinical decisions and may hinder interpretation by causing indecision, especially in urgent test results.(6)
In summary, MU is a critical factor that must be carefully managed to ensure that the results are reliable and useful for the intended practical application, as it directly affects the reliability and validity of the obtained results.(7) MU provides a quantitative indication of result quality, as these characteristics are inversely proportional.(25) The absence of this information makes it difficult to assess the precision and accuracy of the results, even though there are regulations and quality programs that clinical laboratories must follow. Consequently, many physicians end up evaluating the quality of results empirically and subjectively, often without a basis in evidence or statistics due to unfamiliarity with these concepts. Ignoring or underestimating measurement uncertainty can lead to significant errors, affecting the quality of the measurement process and, consequently, patient safety.(7)
FINAL CONSIDERATIONS
The estimation and quantification of measurement uncertainty are fundamental in laboratory and clinical practice, as they ensure the precision and reliability of diagnostic test results. Understanding uncertainty is essential for the appropriate interpretation of results, especially in critical contexts such as disease diagnosis, where small deviations can lead to incorrect clinical decisions. The top-down and bottom-up approaches provide complementary strategies for determining uncertainty, each with specific applications in the clinical setting. Despite the guidelines and standards that regulate laboratory practice, the lack of familiarity among healthcare professionals with the concept of uncertainty can compromise the effectiveness of diagnosis and patient management. Clinical laboratories can perform MU estimations using electronic spreadsheets with various approaches, as described in this article, including adopting more than one approach complementarily, such as analyzing reproducibility and bias together, using a set of IQC and EQC data, such as participation in PT. However, the incorporation of software and interlaboratory quality control programs that allow the automation of the MU estimation process (e.g., Bio-Rad UNITY™,(26) Randox Acusera 24/7™ (27) and Controllab CI ONLINE™ (28)) can significantly contribute to integrating this concept into laboratory and clinical practice. Therefore, it is imperative that the medical community acknowledges the importance of measurement uncertainty and works to incorporate it into clinical decision-making, promoting safer and more effective patient care. The future of laboratory medicine will depend on a more holistic approach, in which the quality of results, including their uncertainties, is considered a priority in healthcare delivery.
REFERENCES
- Vocabulário Internacional de Metrologia: Conceitos fundamentais e gerais e termos associados (VIM 2012). Duque de Caxias, RJ. 2012. 94p. Available at: <http://www.inmetro.gov.br/inovacao/publicacoes/vim_2012.pdf>. Accessed on: August 14, 2024.
- Ćelap I, et al. Measurement uncertainty estimation recommendations. Biochemia medica (Zagreb) 2017;27(3):030502. Available at: <https://doi.org/10.11613/BM.2017.030502>. Accessed on: August 14,
- EUROCHEM / CITAC (2012). Quantifying uncertainty in analytical measurement – QUAM:2012.P1, Guide CG4, 3nd ed. 2012. Available at: <https://eurachem.org/images/stories/Guides/pdf/QUAM2012_P1.pdf>. Accessed on: August 21,
- ACC Engenharia de medição. Processo de medição: entenda seu impacto nos processos e produtos! Available at: <https://accmetrologia.com.br/backup-plim/processo-de-medicao-entenda-seu-impacto-nos-processos-e-produtos/>. Accessed on: August 18, 2024.
- CLSI EP29-A – Expression of Measurement Uncertainty in Laboratory Medicine; Approved Guideline. Vol. 32, Nº 4, 2012. Available at: <https://clsi.org/standards/products/method-evaluation/documents/ep29/>. Accessed on: August 21,
- Pereira P. Uncertainty of Measurement in Medical Laboratories. DOI: 10.5772/62437. In book: New Trends and Developments in Metrology (pp.51-80). Publisher: InTech, Editors: Luigi Cocco, (2016). Available at: <https://www.researchgate.net/publication/303289783_Uncertainty_of_Measurement_in_Medical_Laboratories>. Accessed on: August 18,
- Fernandes JLN, Wollinger W, Garrido BC. Rastreabilidade em medicina laboratorial: um estímulo global para resultados exatos no cuidado com o paciente. Jornal brasileiro de Patologia e Medicina Laboratorial, v. 55, n. 4, p. 402–411, 2019. Available at: <https://www.scielo.br/j/jbpml/a/5DrKpSwPrM93mcmNNp7Fkqw/>. Accessed on: August 20,
- Belk WP, Sunderman FW. A survey of the accuracy of chemical analyses in clinical laboratories. American Journal of Clinical Pathology, v. 17, n. 11, p. 853–861, 1947. Available at: <https://academic.oup.com/ajcp/article-abstract/17/11/853/1761299?redirectedFrom=fulltext>. Accessed on: August 20,
- Ricós C, et al. Current databases on biological variation: pros, cons and progress. Scandinavian Journal of Clinical and Laboratory Investigation, v. 59, n. 7, p. 491–500, 1999. Available at: <https://pubmed.ncbi.nlm.nih.gov/10667686/>. Accessed on: August 21,
- Kallner A. Estimation of uncertainty in measurements in the clinical laboratory. Clinical chemistry and laboratory medicine 2013; 51(12): 2249–2251. DOI 10.1515/cclm-2013-0749. Available at: <https://www.degruyter.com/document/doi/10.1515/cclm-2013-0749/html>. Accessed on: August 18,
- Milinkovic, et al.: Uncertainty of measurement in laboratory medicine. Journal of Medical Biochemistry 2018; 37 (3). DOI: 10.2478/jomb-2018-0002. Available at: <https://pubmed.ncbi.nlm.nih.gov/30584397/>. Accessed on: August 18,
- Available at: <https://towardsdatascience.com/understanding-the-68-95-99-7-rule-for-a-normal-distribution-b7b7cbf760c2>. Accessed on: August 10, 2024.
- Junior E. Desvendando o Teorema Central do Limite. Available at: <https://medium.com/data-hackers/desvendando-o-teorema-central-do-limite-17cbb13beb1a>. Accessed on: September 19,
- Milinković N, Jovičić S, Ignjatović S. Measurement uncertainty as a universal concept: can it be universally applicable in routine laboratory practice? Critical reviews in clinical laboratory sciences, v. 58, n. 2, p. 101–112, 2021. Available at: <https://pubmed.ncbi.nlm.nih.gov/32672116/>. Accessed on: August 21,
- Wernimont GT. Use of statistics to develop and evaluate analytical methods, AOAC: Arlington, 1985.
- Royal Society of Chemistry / Analytical Methods Committee. Uncertainty of measurement: implications of its use in analytical science Analyst 1995, v. 120, p. 2303-2308.
- de Oliveira EC, de Aguiar PF. Comparação de diferentes abordagens para avaliação da incerteza Química nova, 32, n. 6, 2009. Available at: <https://doi.org/10.1590/S0100-40422009000600051>. Accessed on: August 18, 2024.
- Rigo-Bonnin R, et al. Different top-down approaches to estimate measurement uncertainty of Whole blood tracolimus mass concentration values. Clinical biochemistry 57 (2018) 56-61. Available at: <https://doi.org/10.1016/j.clinbiochem.2018.05.005>. Accessed on: August 21,
- Frenkel R, Farrance I, Badrick T. Bias in analytical chemistry: A review of selected procedures for incorporating uncorrected bias into the expanded uncertainty of analytical measurements and a graphical method for evaluating the concordance of reference and test procedures. Clinica chimica acta; international journal of clinical chemistry, v. 495, p. 129–138, 2019. Available at: <https://www.sciencedirect.com/science/article/abs/pii/S0009898119317383?via%3Dihub>. Accessed on: August 21,
- Eren F, Oguz, EF. The estimation of measurement uncertainty of glycated hemoglobin at atellica solutions. International Journal of Medical Biochemistry, 2021.. DOI: 10.14744/ijmb.2021.84755. Available at: <https://internationalbiochemistry.com/jvi.aspx?un=IJMB-84755&volume=>. Accessed on: August 21,
- ISO 15189-2012 Medical laboratories – Requirements for quality and competence. International Organization for Standardization, 2012.
- Coskun A, Berçik İnal B, Serdar M. Measurement uncertainty in laboratory medicine: the bridge between medical and industrial metrology. Turkish journal of biochemistry, v. 44, n. 2, p. 121–125, 2019. Available at: <https://www.degruyter.com/document/doi/10.1515/tjb-2019-0170/html>. Accessed on: August 20,
- Plebani M, et al. What information on measurement uncertainty should be communicated to clinicians, and how? Clinical biochemistry, v. 57, p. 18–22, 2018. Available at: <https://www.sciencedirect.com/science/article/abs/pii/S0009912017311803?via%3Dihub>. Accessed on: August 18,
- Galindo-Méndez M, Sánchez-López A, Cruz-Fuentes L. The estimation of uncertainty of measurement of glycated hemoglobin as an analytical performance specification and in the interpretation of its results. Clinical biochemistry, v. 63, p. 92–96, 2019. Available at: <https://www.sciencedirect.com/science/article/abs/pii/S0009912018309263?via%3Dihub>. Accessed on: August 20,
Correspondence
José Robson Venturim
E-mail: [email protected]
